The subtle art of carbon benchmarking
The GHG Protocol is the main accounting standard for measuring and reporting greenhouse gas emissions. It delineates three distinct ‘scopes’ of carbon: Scope 1 and 2 are considered part of the company’s direct operational footprint. Scope 1 direct emissions arise from assets owned or controlled by the company, whereas Scope 2 emissions are indirect emissions due to the purchase of energy, such as electricity or district heating. These two scopes are well-defined, but the main benchmarking challenge lies in Scope 3 emissions, a catch-all bucket for all value chain emissions. When comparing emissions to peers, it should be clearly stressed which scopes are compared to prevent any misrepresentations.
If your company wishes to compare Scope 3 emissions in addition to Scope 1 and 2 emissions, one should be aware of the Scope 3 sources reported by peers. Often, it does not constitute a full Scope 3 assessment, but only includes a subsection of categories that are easily measurable, such as business travel. For more complex emission categories, such as purchased goods and services, or end-of-life treatment of sold products, there is often a lack of data. As such, companies may simply exclude these material categories from their Scope 3 assessment, in practice underreporting with respect to what would be a complete report (MSCI, 2020). Also, due to the fundamental complexity and novelty of Scope 3 measurements for many companies, mistakes and judgment errors are prone to be made, making the reference benchmark harder to trust.
The central paradox for benchmarking is that companies and investors who value sustainability efforts also tend to spend significant resources on it, thereby ensuring a more complete and accurate overview. In essence, this is a positive development because it provides a comprehensive overview of the company’s carbon hotspots. However, this can create a benchmark bias when comparing such assessments to a baseline of peers whose resources and reports are not up to par. With a lack of oversight on all material emissions sources among peers, it may falsely appear that frontrunning companies and investors with comprehensive reporting have a higher total footprint.
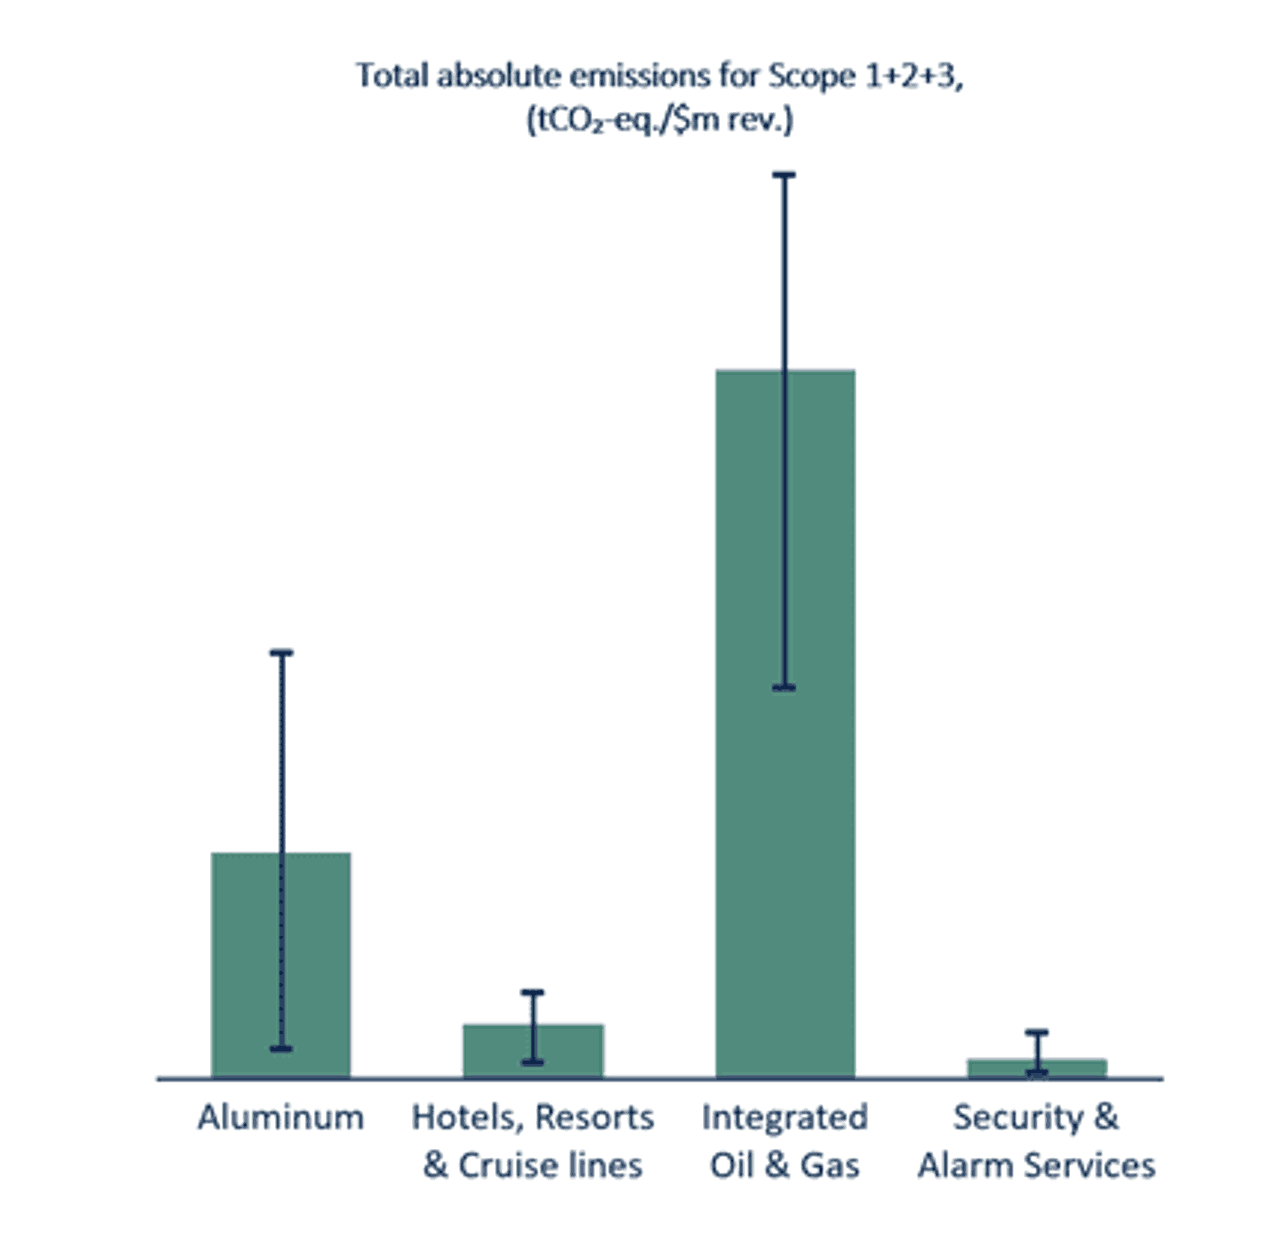
Moreover, if you want to compare companies that are adequately similar in their business propositions, you’ll need to segment the business landscape into even smaller buckets, ultimately leading to an insufficient sample size for accurate comparisons. Typical datasets on carbon emissions mostly use listed companies as proxy data and contain between 10,000 to 20,000 companies in total. If you segregate that into regional (approximately 200 countries) and industry buckets (GICS classification has around 160 sub-industries), it follows that the sample size becomes very small for certain combinations.